
Tips for Estimating Power in Complex Statistical Models

Many of us are proud to have learned sophisticated statistical methods like structural equation modeling and multilevel modeling and are eager to use these methods to test increasingly sophisticated hypotheses. But before we can get our next grant or publish our next article, we come face to face with the dreaded power analysis.
Advanced statistics classes almost never teach us how to estimate power to test innovative hypotheses embedded in complex models. After finally producing that obligatory power estimate, we may be left with a queasy feeling in the pit of our stomach that the analysis may not actually tell us much at all about the hypothesis of interest.
After repeatedly observing such mismatches, Patrick Curran, psychology professor and statistician at the University of North Carolina at Chapel Hill, noted to us, “As statistical models have become more and more complex, power depends on dozens of parameters that are almost never taken into consideration. In such cases, I’m not sure I have ever seen a power analysis that I believed in.”
Terms to Know
Power: The probability that a study will be able to detect an effect of a given size. Power is affected by many factors, including the significance level, sample size, effect size, and type of analysis. Studies that have inadequate power may produce false negatives and impede research progress.
Power Analysis: A statistical technique used to estimate the expected power for an analysis. Power analyses allow researchers to plan studies more effectively by recruiting an appropriate number of participants and optimizing different facets of their study design.
Parameter: A number that characterizes some aspect of the population of interest, often estimated by statistics applied to a sample drawn from that population. Such statistics are sometimes embedded in complex models that estimate multiple parameters, some of which are the researcher’s principal concern (i.e., the primary parameter), whereas others are not (i.e., secondary parameters).
Latent Variables: Variables that are inferred from data but are not directly observed.
Causal Paths: Statistical relations among variables that are associated with path coefficients (i.e., numbers) that represent the strength and direction of these relations
Factor Loadings: Numerical values that represent the strength of relation between observed and latent variables. When standardized, these values range from -1 to 1.
Correlated Disturbances: Associations between error terms in a statistical model. When two variables have a non-zero correlated disturbance, it indicates that the association between those variables was not fully explained by the predictor(s) in the model.
Mediation: When a causal relation between two variables (i.e., direct effect) is partially or fully explained by another variable, called a mediator.
Think beyond the power analysis you know
Researchers often make two mistakes. The first is that we conduct the power analysis we know how to do, not the one that needs to be done. As our research questions grow in complexity, power analyses become dramatically more difficult. Sure, we can estimate power to detect the effect of a single predictor in a multiple regression model. But as soon as we convert manifest variables into latent variables, consider more causal paths, add more timepoints, or allow for correlated disturbances (all things that are often necessary), our models become so complex that power analyses are really hard to do. It is so much easier to report the power for the regression analysis. Heck, there is an app for that (G*Power).
But there are apps for the former as well. Wang and Rhemtulla’s (2021) PwrSEM (https://github.com/yilinandrewang/pwrSEM) allows you to estimate the power to detect any path in just about any structural equation model, as long as you can guesstimate the values for the model path coefficients. Alternatively, WebPower (Zhang & Yuan, 2018) lets you do the same, as long as you can guesstimate the underlying covariance matrix. And Muthén and Muthén (2002) have outlined Mplus methods for power estimation, as long as you can write the program to analyze your data in Mplus. These are valuable tools that we should learn to use.
Avoid arbitrary assumptions in models
The second problem is that most power analysts make huge and usually arbitrary assumptions about their underlying models. Every time we embellish our model with a new parameter, we add another dial that could turn up or down our power to detect the effect of interest depending on what the value of that parameter turns out to be. These secondary parameters can affect power in unexpected ways. Researchers carefully justify the magnitudes of path coefficients that are part of their primary hypothesis. Rarely, if ever, do they justify the guesstimates of these secondary parameters, some of which can have a huge impact on power.
Inspired by an episode of Quantitude (Curran & Hancock, 2023, January 10), a podcast about quantitative analysis, our team recently suggested a possible solution. We recommended that power estimation be embedded in a factorial design, where power to detect the primary parameter of interest is estimated as a function of high and low plausible values for different types of secondary parameters in the model. The result is not a single power estimate that pertains to a highly specific situation but upper and lower bounds for power that pertain across a range of plausible situations.
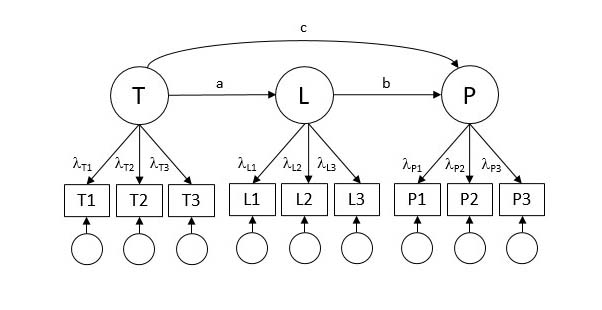
For example, Figure 1 depicts a latent variable mediation model where learning (L) mediates the relation between treatment (T) and performance (P). Let us imagine that the researchers are interested in their power to detect mediation (i.e., the ab effect), but the model contains many other parameters as well: path c plus nine factor loadings. Fascinatingly, the power to detect ab may vary depending on the values of these other parameters, even when everything else stays the same (i.e., no change in sample size, p values, or path a and b effect sizes).
We recommend estimating power under a range of plausible values for these other parameters (see also Hancock & Feng, 2024). On the basis of previous research (or common sense), we select high and low plausible values for each type of secondary parameter. We estimate power under different combinations of these plausible values. This systematic set of power analyses yields two important things: (1) a range of power estimates that covers a variety of plausible situations that could emerge when the study is conducted, and (2) potential ways to improve power other than increasing the sample size.
“This systematic set of power analyses yields two important things: (1) a range of power estimates that covers a variety of plausible situations that could emerge when the study is conducted, and (2) potential ways to improve power other than increasing the sample size.”
David Cole and George Abitante
Applying these steps to the latent variable mediation example in Figure 1 reveals that power to detect path ab increases (sometimes dramatically) as a function of the factor loadings but is not affected much at all by the magnitude of path c—even when holding the sample size, p value, and everything else constant. The result is a range of plausible power estimates, not a single estimate that pertains under only one specific set of conditions. In this case, we would discover that we are adequately powered if our loadings are strong but inadequately powered if our loadings turn out to be at the low end of the plausible range. Furthermore, the results suggest that we might be able to increase power more economically by improving the reliability of our measures than by increasing their sample size.
Our upcoming paper in Advances in Methods and Practices in Psychological Science demonstrates how to apply these steps to a series of increasingly complex statistical models. Following these steps yields not only a more comprehensive picture of our power but can sometimes suggest power-enhancing changes that go beyond simply increasing the sample size.
Feedback on this article? Email apsobserver@psychologicalscience.org or login to comment.
Cole, D., Abitante, G., Kan, H., Liu, Q., Preacher, K., Maxwell, S. (in press). Practical problems estimating and reporting power when hypotheses are embedded in complex statistical models. Advances in Methods and Practices in Psychological Science.
Curran, P. J., & Hancock, G. R. (Hosts) (2023, January 10). Model-based power analysis: The power of *what* (Season 4, Episode 13) [Audio podcast episode]. In Quantitude.
Hancock, G. R., & Feng, Y. (2024, June 25). nMAX: Restoring caution, integrity, and practicality to the sample size planning process [Paper presentation]. Modern Modeling Methods Conference, University of Connecticut, CT, United States.
Muthén, L. K., & Muthén, B. O. (2002). How to use a Monte Carlo study to decide on sample size and determine power. Structural Equation Modeling, 9, 599–620.
Wang, Y. A., & Rhemtulla, M. (2021). Power analysis for parameter estimation in structural equation modeling: A discussion and tutorial. Advances in Methods and Practices in Psychological Science, 4, Article 2515245920918253.
Zhang, Z., & Yuan, K.-H. (2018). Practical statistical power analysis using WebPower and R. ISDSA Press.


APS regularly opens certain online articles for discussion on our website. Effective February 2021, you must be a logged-in APS member to post comments. By posting a comment, you agree to our Community Guidelines and the display of your profile information, including your name and affiliation. Any opinions, findings, conclusions, or recommendations present in article comments are those of the writers and do not necessarily reflect the views of APS or the article’s author. For more information, please see our Community Guidelines.
Please login with your APS account to comment.